Data preparation
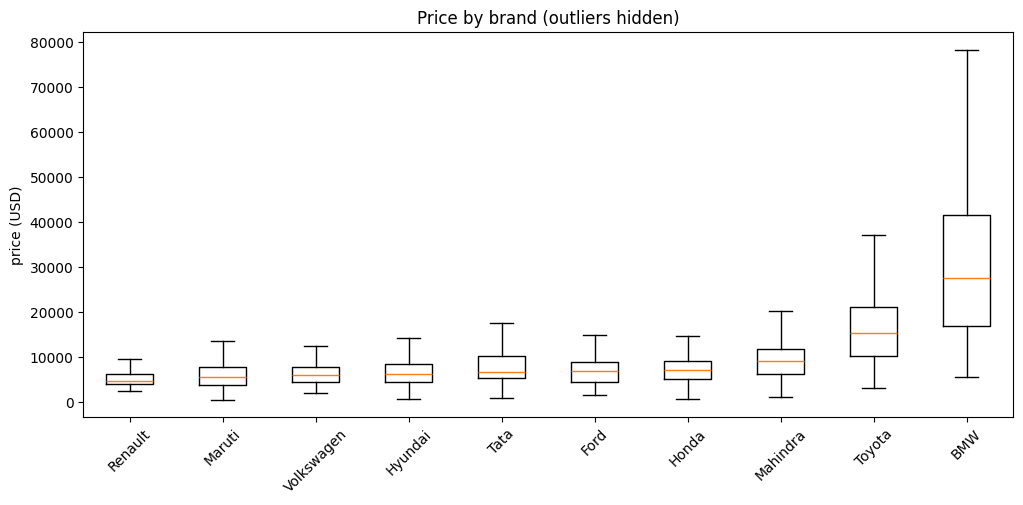
Removed 167 duplicate listings and 12 impossible mileage values, treated zero-seat cars as missing, and built leak-free scikit-learn pipelines for imputation, scaling, and encoding.
Graduate coursework · M.S. Big Data Analytics
Two end-to-end data mining projects from BGDA 510: predicting used-car prices from 15,232 marketplace listings, and modeling Titanic passenger survival. Each one follows the same workflow: clean and validate the data, compare models against a baseline, tune on training data only, and test once.
Project 1 · Regression and classification
Can a dealer estimate a fair price for a car from its age, mileage, engine, power, brand, and fuel type?
Removed 167 duplicate listings and 12 impossible mileage values, treated zero-seat cars as missing, and built leak-free scikit-learn pipelines for imputation, scaling, and encoding.
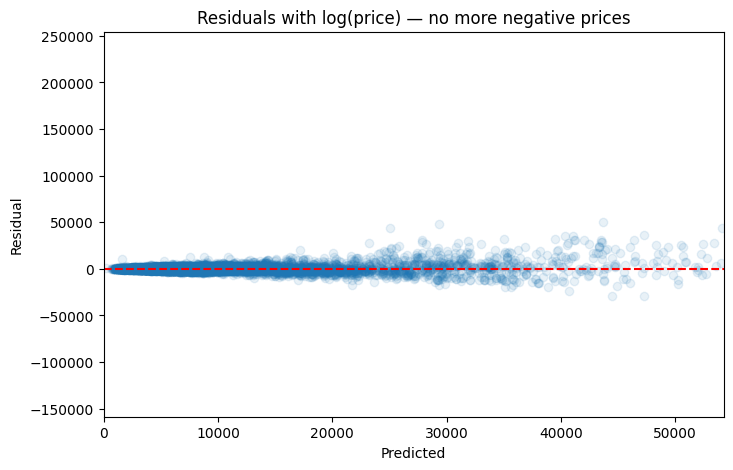
Compared a mean baseline, linear, log-price, Ridge, Lasso, and decision-tree models with 5-fold cross-validation. Modeling log price cut RMSE from $6,255 to $4,214 and removed 591 negative price predictions.
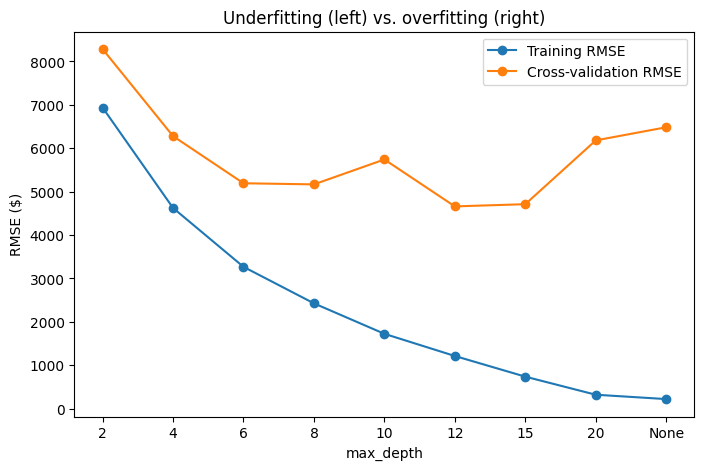
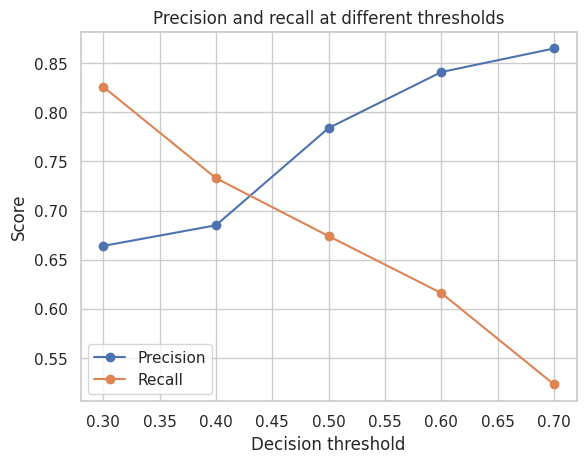
The tuned log-price Ridge model scored R² 0.857 on the untouched test set, close to its cross-validation score, so it generalizes well. A follow-up classifier flagged premium cars (over $10,000) with a cross-validated F1 of 0.89 (tuned gradient boosting).
Also in this project: a market basket analysis of 2,000 simulated accessory purchases (support, confidence, and lift), where roof racks and bike racks showed a lift of 6.5.
Project 2 · Classification and association rules
Which passenger traits are linked to survival, and how well can a model predict it?
Built a data quality report (77% of cabin and 20% of age values missing), filled age by passenger title, and engineered Title, FamilySize, and IsAlone features.
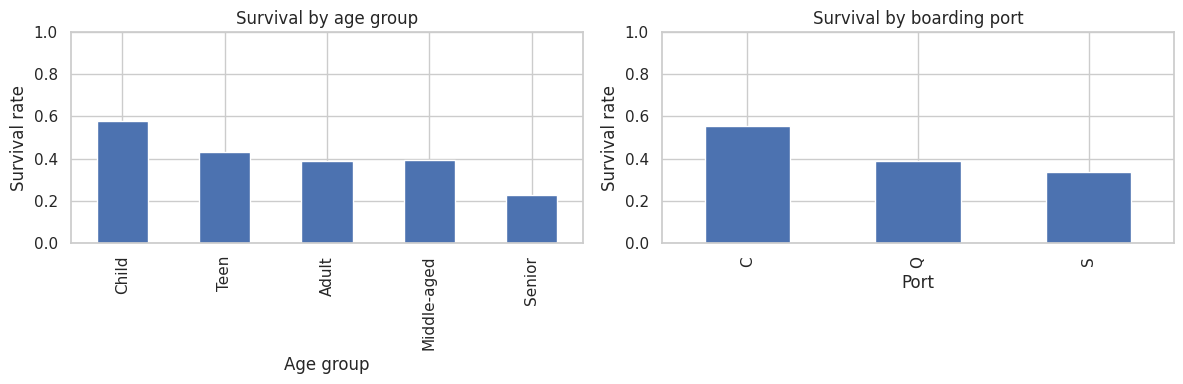
Cherbourg passengers survived more often, but a cross-tab showed 51% of them were first class. Passenger class, not port, explains most of the gap.
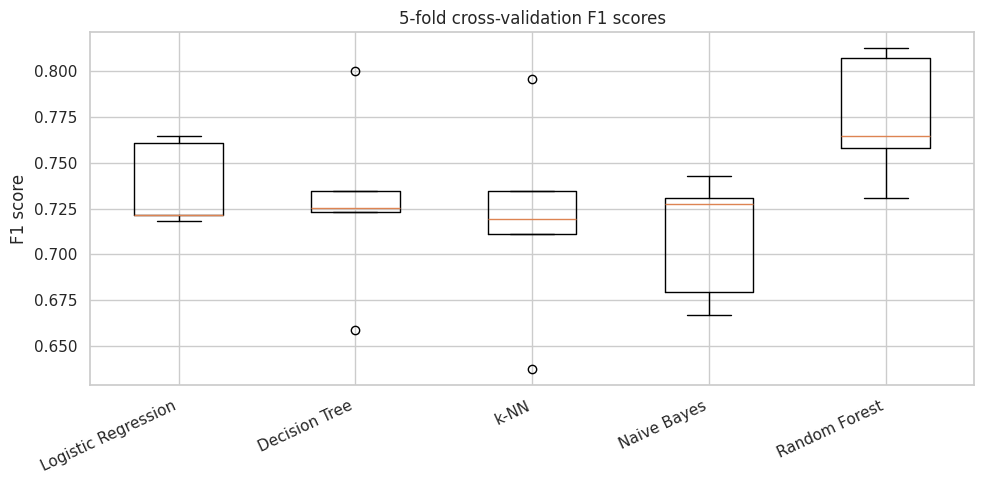
Compared five classifiers with 5-fold cross-validation, tuned a random forest with GridSearchCV (test F1 0.77), and mined association rules such as female and first class leading to survival (97% confidence).
What these projects show
Both projects use a held-out test set touched only once, compare every model to a simple baseline, and explain results in plain language. The full notebooks, with code and outputs, are on GitHub.